Welcome again. Today I am taking a deep dive into the NDX and S&P 500, and the outlook here in Q1 and Q2.
In late October, as the bears piled on to was already a multimonth pullback in equities starting in mid July, both the stock markets and crypto markets (BTC & ETH) had all the makings of a major low being put in place and a multimonth uptrend being the most likely outcome. On my twitter @ https://twitter.com/Zwack_Charts, I was intentionally vocal about the upside in these markets being the highest probability bet. The S&P has rallied 17% since the Oct 27th low, and the NDX rallied 20%. Bitcoin put in a higher low on Oct 12th, and has rallied 83% into the high made on ETF hype day, Jan 11th. Ethereum bottomed Oct 12th, and has rallied 78% into Jan 12th.
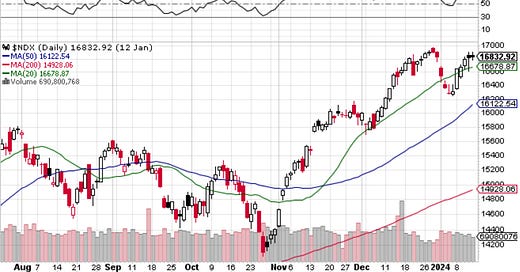
That leaves us where we are now (SPX/NDX charts below for reference). As the markets matured to the upside into December, the first sign of caution and that things were starting to change and weaken internally was Dec 20th, in which both the NDX and SPX put in daily outside reversal candles and closed right at the lows of the day. Not a bearish signal in itself, it was and continues to be merely a piece of information to be aware of. The markets had begun rotating underneath the hood, and with that brings increasing volatility in how the markets trade both up and down in trend. Then, both the NDX & SPX went on to drift higher into year end, but as the new year came the market started pulling back and it sliced right through the 20 day MA, the first time doing so since the Oct bottom. That is a sign the current market uptrend has gotten old, the market is now changing hands internally, and were at a typical late stage point in the move. Could we get a 7-10% correction in the S&P and a 8-12% correction in the NDX? That would be ideal IMO. There is unfilled gaps in mid November, and while you may be thinking that is pretty deep, this bull market is maturing, and as markets mature we see more sloppy volatile price action on both upside and downside moves. That would be considered a healthy pullback to me still, getting that pullback/correction into February while holding the 200 day MA in both markets with relative ease. That would set the stage for another multiweek/month run into Q2, where 5000 SPX, and maybe even 20,000 NDX becomes all the talk and hype in the finance community.
The internals to us are also indicating a pullback or rotation underway in the markets. The S&P stocks above the 20 day peaked in late November but was plenty strong through December, allowing the market to do what it did. But an eye opening breakdown since 2024 opened, stocks above the 20 are below hovering at or below 50%. Meaning in about half the names, upside momentum has been lost.
S&P stocks below the 50 day peaked at 93% on January 2nd. It is still at 84% due to the time sensitive run up into year end we had, giving the indexes a lot of room to breathe between the 4800 high, and 4600 where the 50 day is now. But 10% of those 500 names have already lost their 50 day, signalling the correction is underway internally.
One call I am very confident in making right now for 2024 is that the 93% reading on S&P stocks above 50 day will be the high for the year. The NDX reading hit 96%. That will also be the high for the year. As this bull market matures from here, what I believe we will see is narrowing participation in the markets. This October-January period will be looked back upon at the best environment where all stocks participated. From here on out, narrowing participation combined with continued leadership from Megacap tech will be what pushes this market higher into Q2 after this correction we are looking for in Q1.. The unfilled November gap in the S&P is at about 4450, and the NDX gap is at about 15600. Thats 7% down from the highs in the S&P, and 8% down in the NDX.
Thanks for reading.


