Market internals weakening rapidly
Multiple indicators suggest market is already correcting under the hood.
Our last post from Jan 16th suggested a market correction was about to unfold. The market, well the SPX and NDX specifically, our two main focuses, took another leg higher after bottoming the following week on the Monday. Led by the Big 5 megacap tech names of Microsoft, Amazon, Google, Meta and Nvidia, they have had an incredible run while seemingly leaving much of the market completely behind. I continue to see strong evidence to suggest that a correction has already started underneath the hood of the market. With internals continuing to detoriate, it continues to suggest caution is warranted and a correction here in Q1 starting in February into March is a high probability event in my eyes.
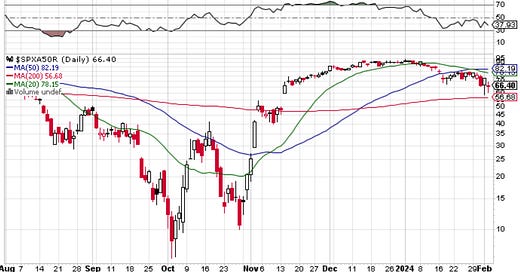
SPX stocks above the 20 day moving average as I write this weekend is only at 57%(up from 40% on Jan 16th however). Stocks above the 50 day average is down to 66%. Meaning one third of the S&P 500 stocks are below their 50 day moving average. On Jan 16th, this number was at 72%. The simple takeaway when analyzing both of these in tandem is that the market on whole is in correction mode, and what the latest two week rally did was allow these some of these stocks that were already below there 50 day moving average on Jan 16th to rally back above an already declining 20 day moving average. But since the stocks above the 50 day has gotten weaker since Jan 16th, not better, the conclusion is that this would be considered a weak rally attempt by these already weak names. See below for the chart of this bearish theme with stocks breaking below the 50DMA.
Now onto the NDX 100, the tech focused market we know and love to trade. It is heavily concentrated in the previously mentioned Megacap tech names, along with Apple to form a seemingly unstoppable top 6 stocks. Internals in the NDX have gotten somewhat stronger since Jan 16th, bouncing from 48% to 63% of stocks above the 20 day. But even this has actually been proceeding back lower since a closing high of 75% on Jan 29th(see chart above). So the past 4 days, the NDX internals have gotten weaker yet the index is slighty higher, only about a third of a percent since then, but still higher with weakening internals. When we look at the NDX stocks above the 50 day, it paints the exact same picture as the SPX stocks noted above. On Jan 16th, NDX stocks above the 50 day was at 79%. Today it is at 70%. Same pattern developing as the S&P, where in both indexes, the stocks above the 20 day is a bit higher than it was on Jan 16th, but in both indexes the stocks above the 50 day is lower. The market this past week allowed for the weak stocks to bounce, but make no mistake, they are still weak and in a downtrend.
The broader Nasdaq Composite is worse than both of these. It has a much broader spectrum of stocks, and quite frankly, the performance internally is downright awful. Stocks above the 20 day is at 40%, above the 50 day is at 46% (down from 55% Jan 16th), and the stocks above the 200 day is at 45%. Incredible weakness internally for an index that is up 4.5% from Jan 16th. Internally, there is simply nothing good happening. Masked once again by literally a handful of megacap tech names that have all had what seems like upside exhaustion moves higher, or blow off top type price action after their earnings reports.
As shown above, on whole, the SPX and NDX are both extremely overbought on both a daily and weekly timeframe. Rare is it to see a weekly RSI over 70 in the NDX, but especially rare to see in the SPX. When I look back over the past 5 years in the SPX, when the RSI gets over a 70 reading happened only 5 times previously. One was the move leading into the Covid crash of 2020. The 2nd was May 2021 which produced a small but healthy 3% pullback. The 3rd was August 2021 where the market produced a 6% correction over 5 weeks. The 4th was the Jan 2022 top which produced the bear market that entire year into the October 2022 lows. And the 5th was the July 2023 highs where the market corrected 11% over the course of 3 months into the recent October lows.
To say I am cautious here is correct. I am looking for and expecting a correction to start unfolding soon. Could the megacap tech moves continue into week and the following? Absolutely. But the risk reward profile is no longer in my favor. I was very caitous in my trading this past week. Intermarket volatility is increasing, which is usually the sign of a late stage market. In my experience, outside of trading a bubble formation, weekly readings of 70+ RSI with declining internals in the major market indexes is not how large returns are made and compounded from a trading perspective.
Thanks for reading.


